Before joining
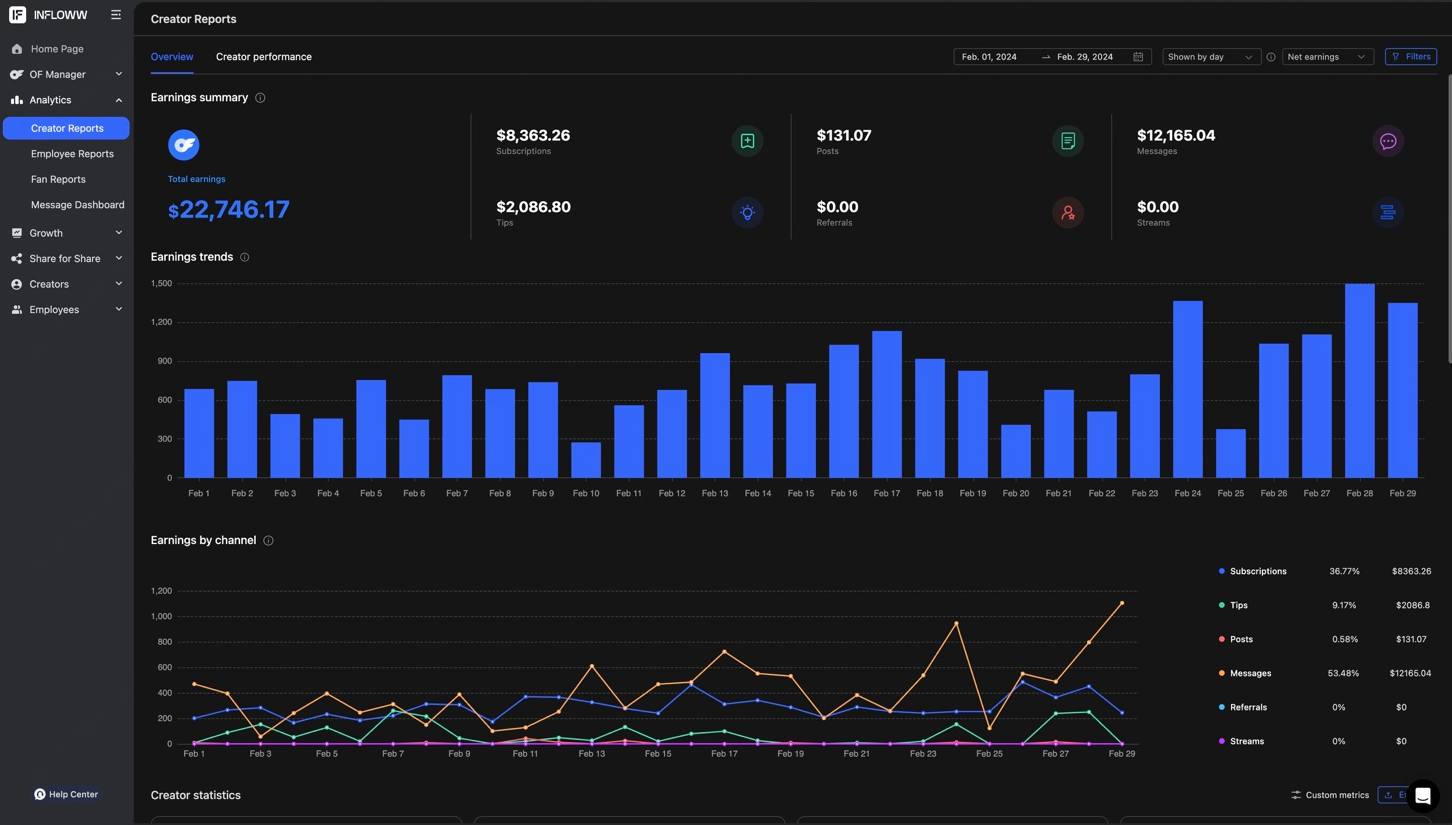
January – February
Baseline performance prior to any structured systems. Revenue inconsistent and reach under-optimised, despite prior content experience.
Baseline established before any systems were implemented.
12-Month Case Study
A documented case study tracking one creator's growth from January through December, with two distinct step-changes after joining playgirls.chat in March.
Net figures account for the standard 20% platform fee. Results are from one managed account and do not guarantee similar outcomes.
Performance by phase
January – February
Baseline performance prior to any structured systems. Revenue inconsistent and reach under-optimised, despite prior content experience.
Baseline established before any systems were implemented.
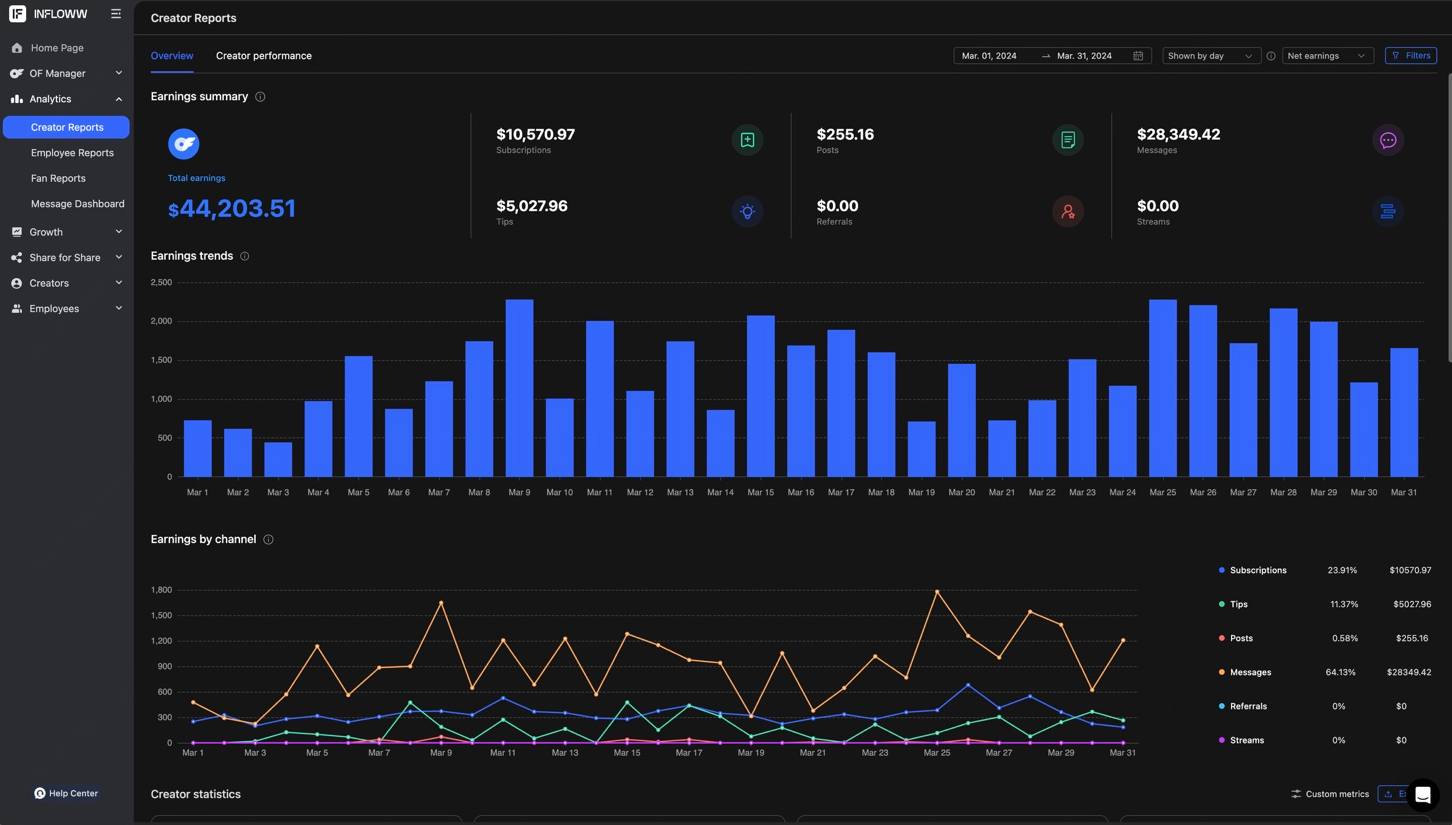
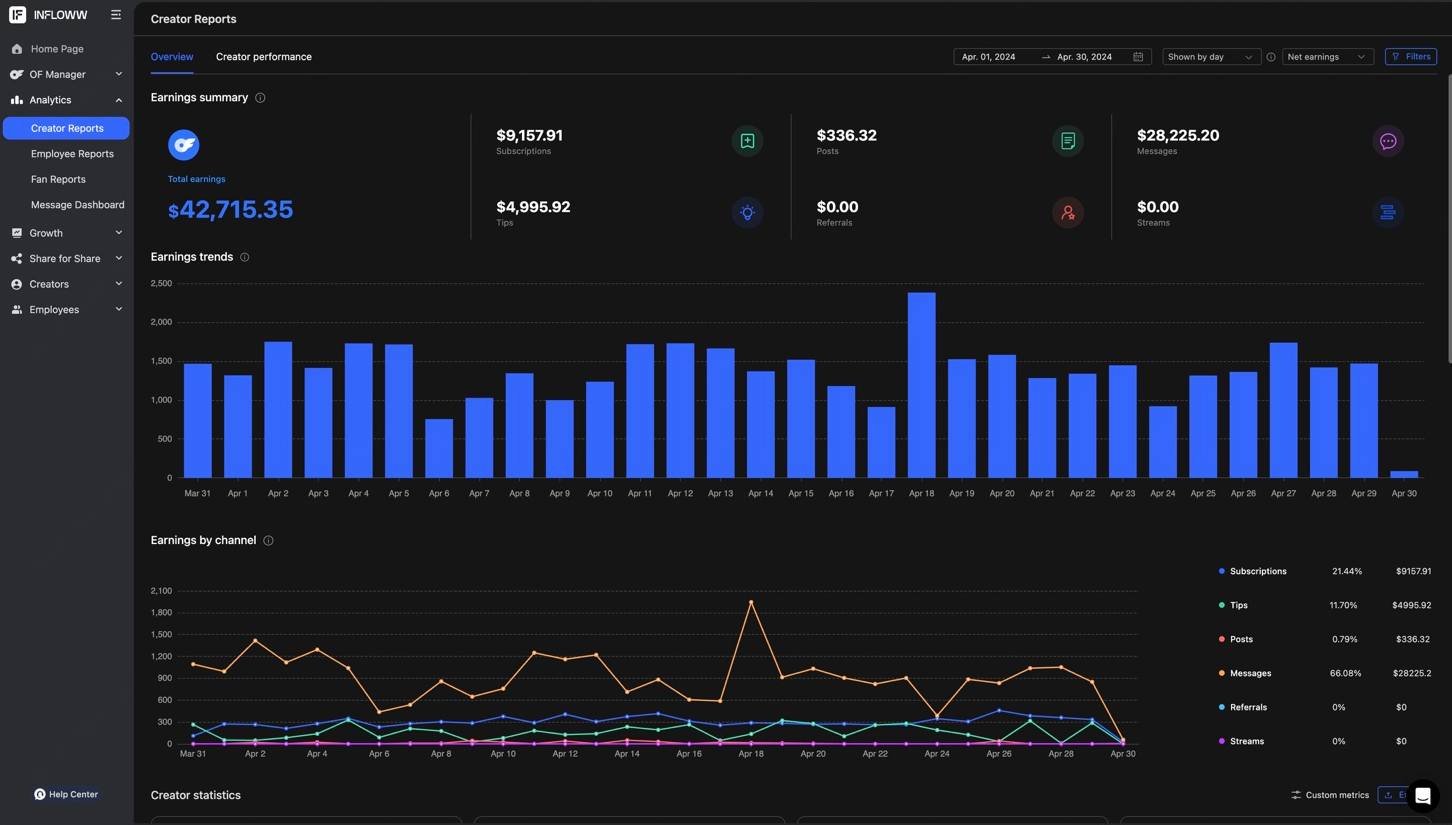
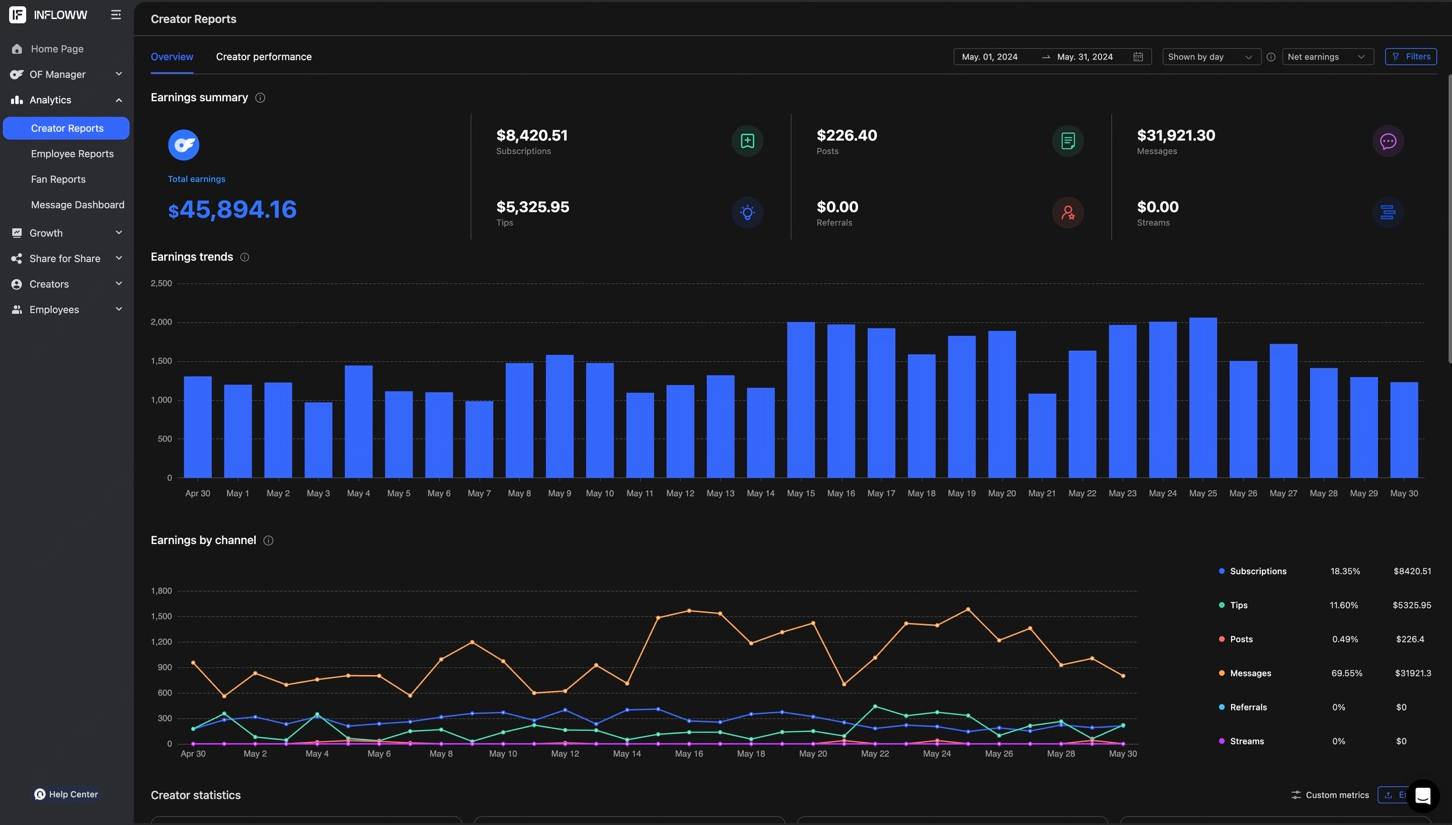
March – May
First 90 days focused entirely on our internal Instagram virality framework — content guided to increase reach, discoverability and followers. No major monetisation changes yet.
Revenue lift driven by audience growth, not monetisation.
June – December
Additional traffic channels added. Our in-house chatting team took over messaging. Conversion systems implemented to lift average spend per fan.
Larger jump driven by conversion, not reach alone.
Month-by-month analysis
| Month | Phase | Net revenue | MoM growth |
|---|---|---|---|
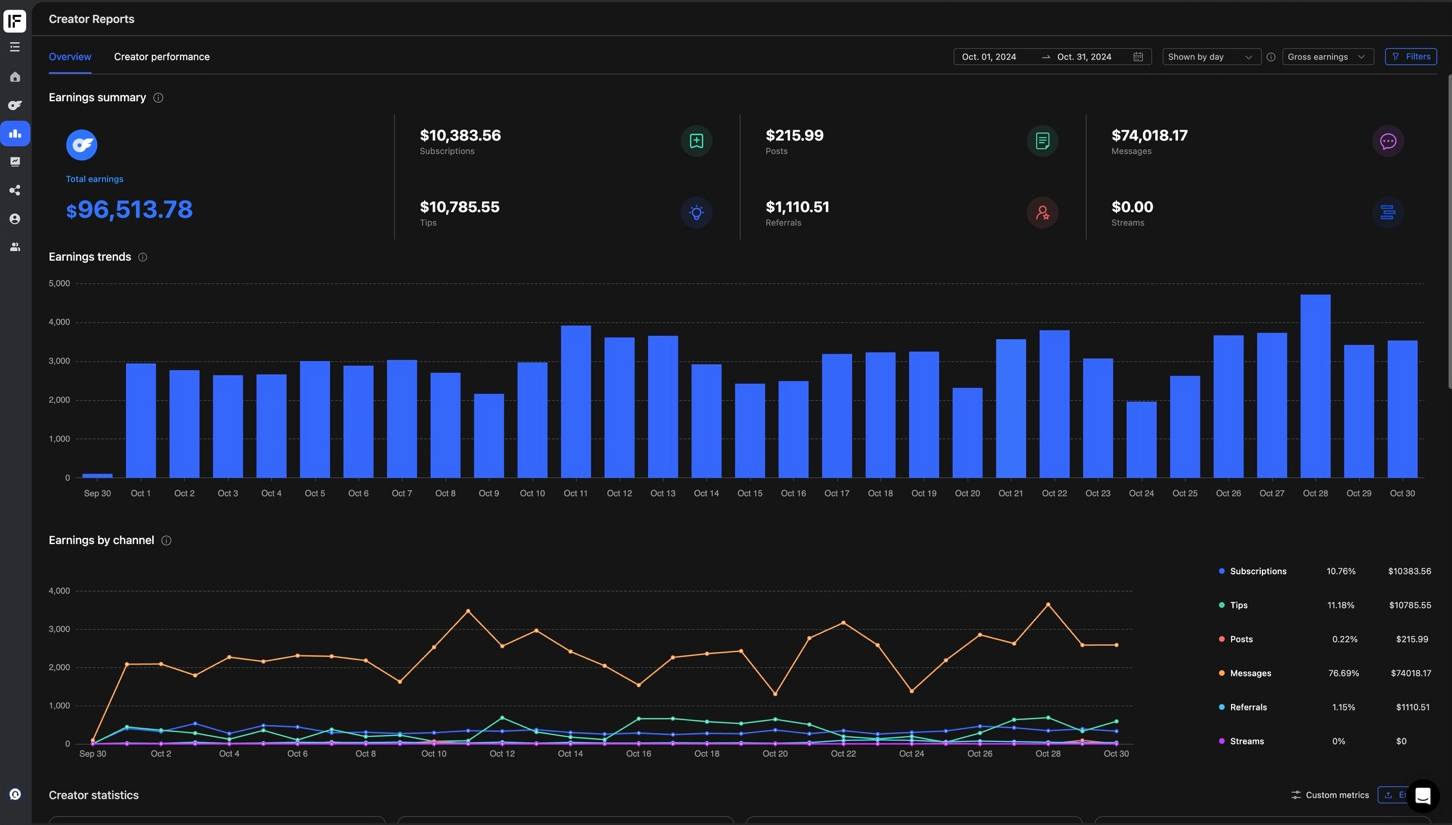
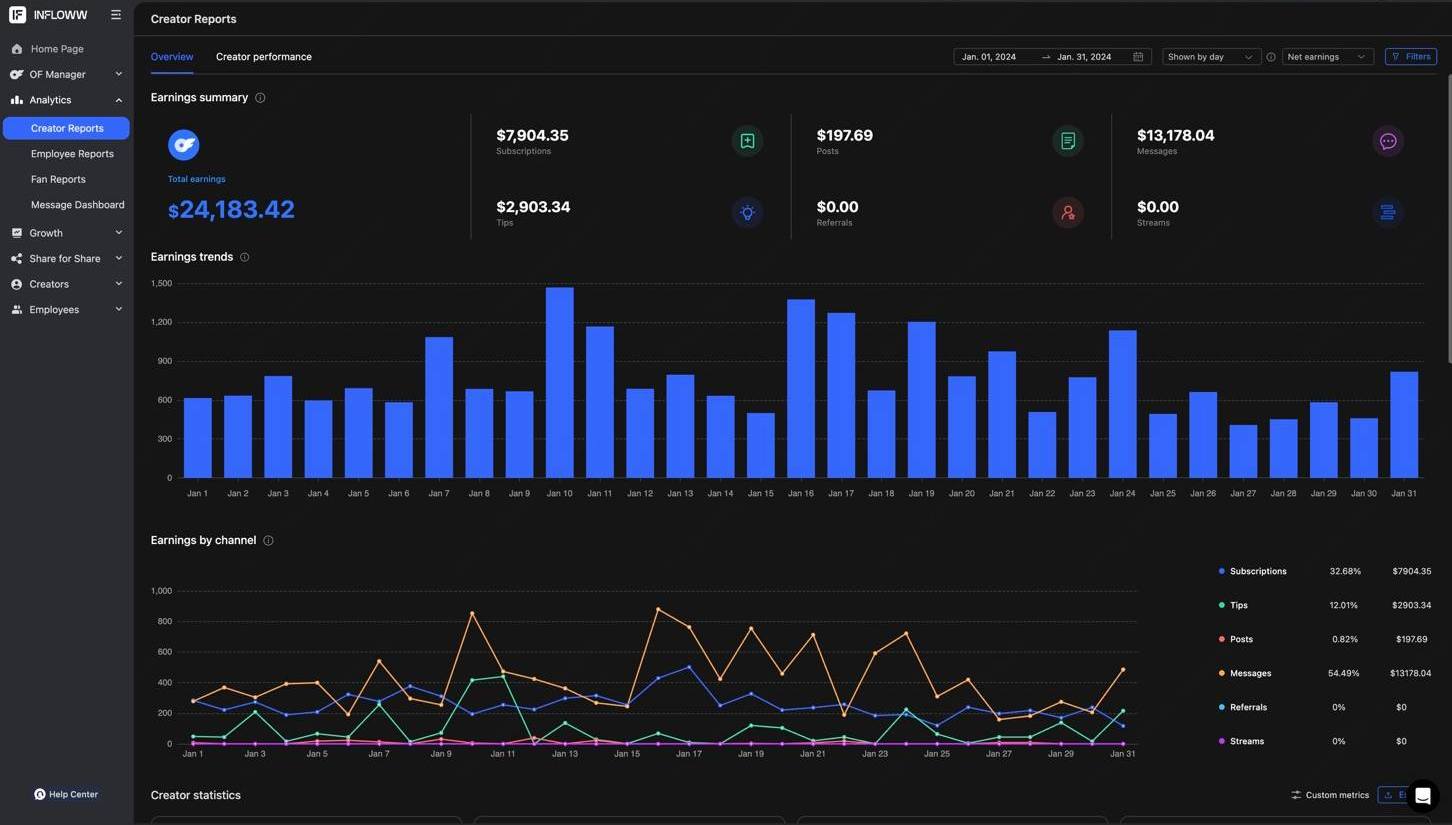
| January | Phase 0 | $24,183 | — |
| February | Phase 0 | $22,746 | -5.9% |
| March | Phase 1 | $44,204 | +94.3% |
| April | Phase 1 | $42,715 | -3.4% |
| May | Phase 1 | $45,894 | +7.4% |
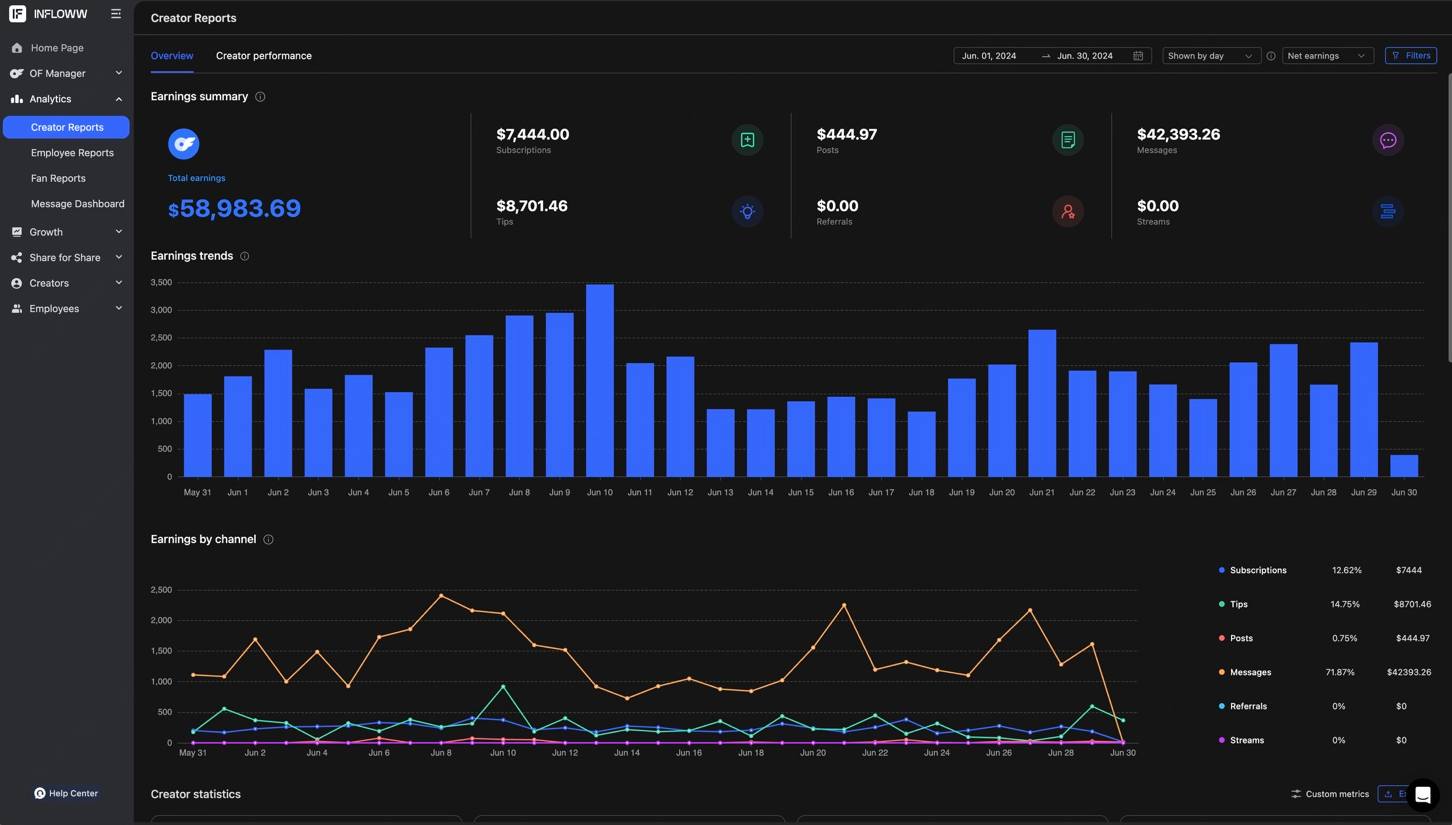
| June | Phase 2 | $58,984 | +28.5% |
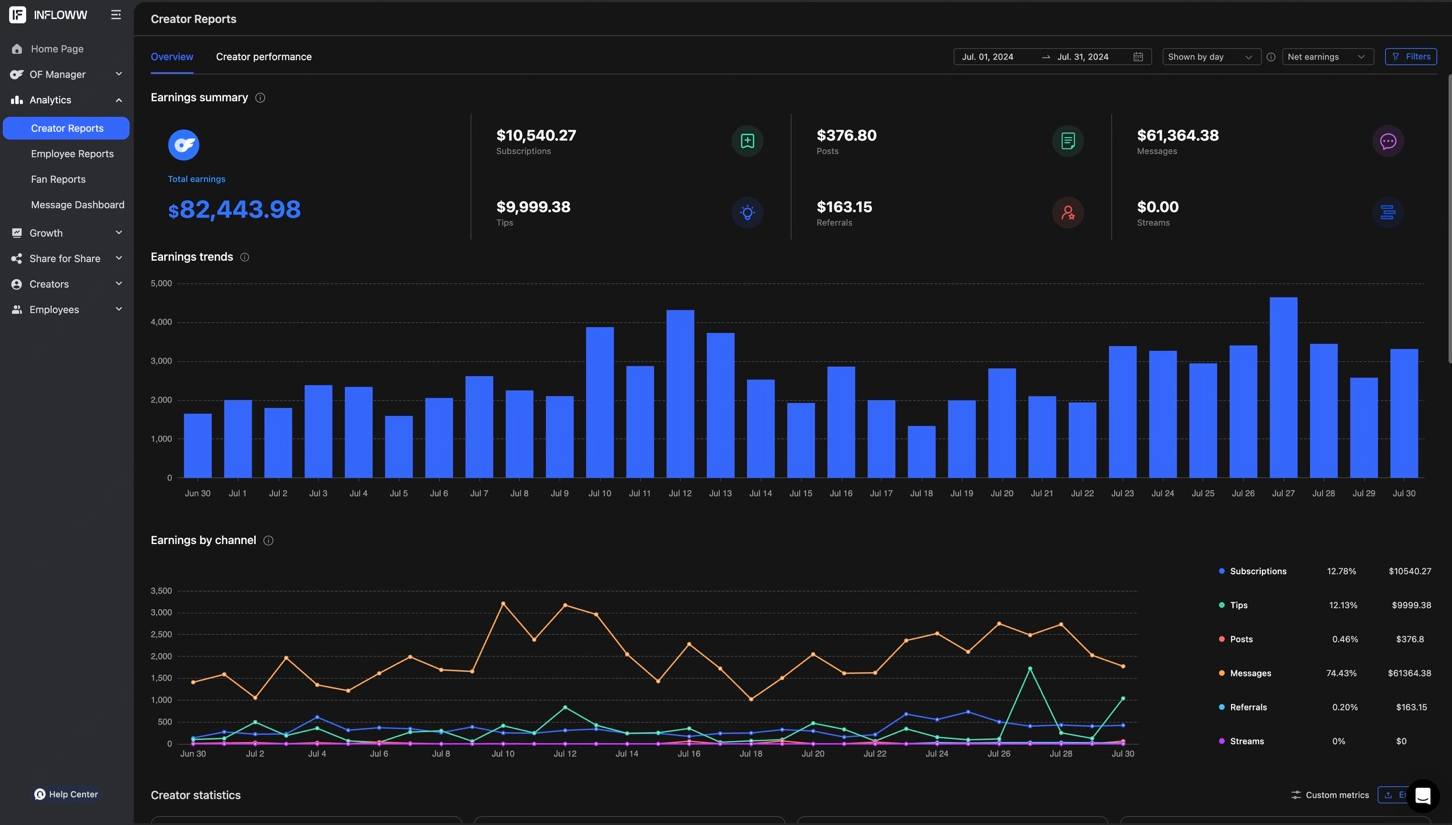
| July | Phase 2 | $82,444 | +39.8% |
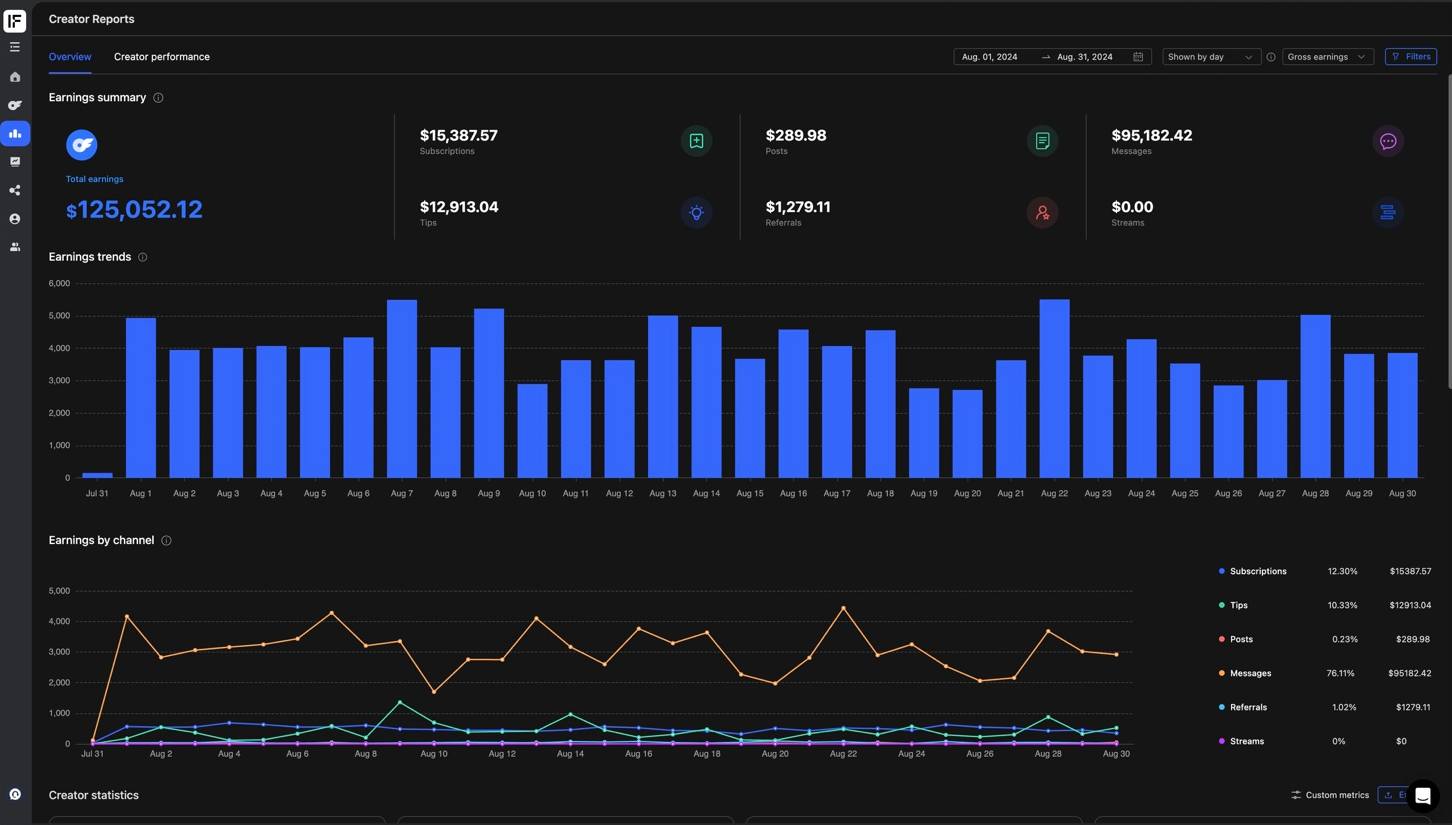
| August | Phase 2 | $100,042 | +21.3% |
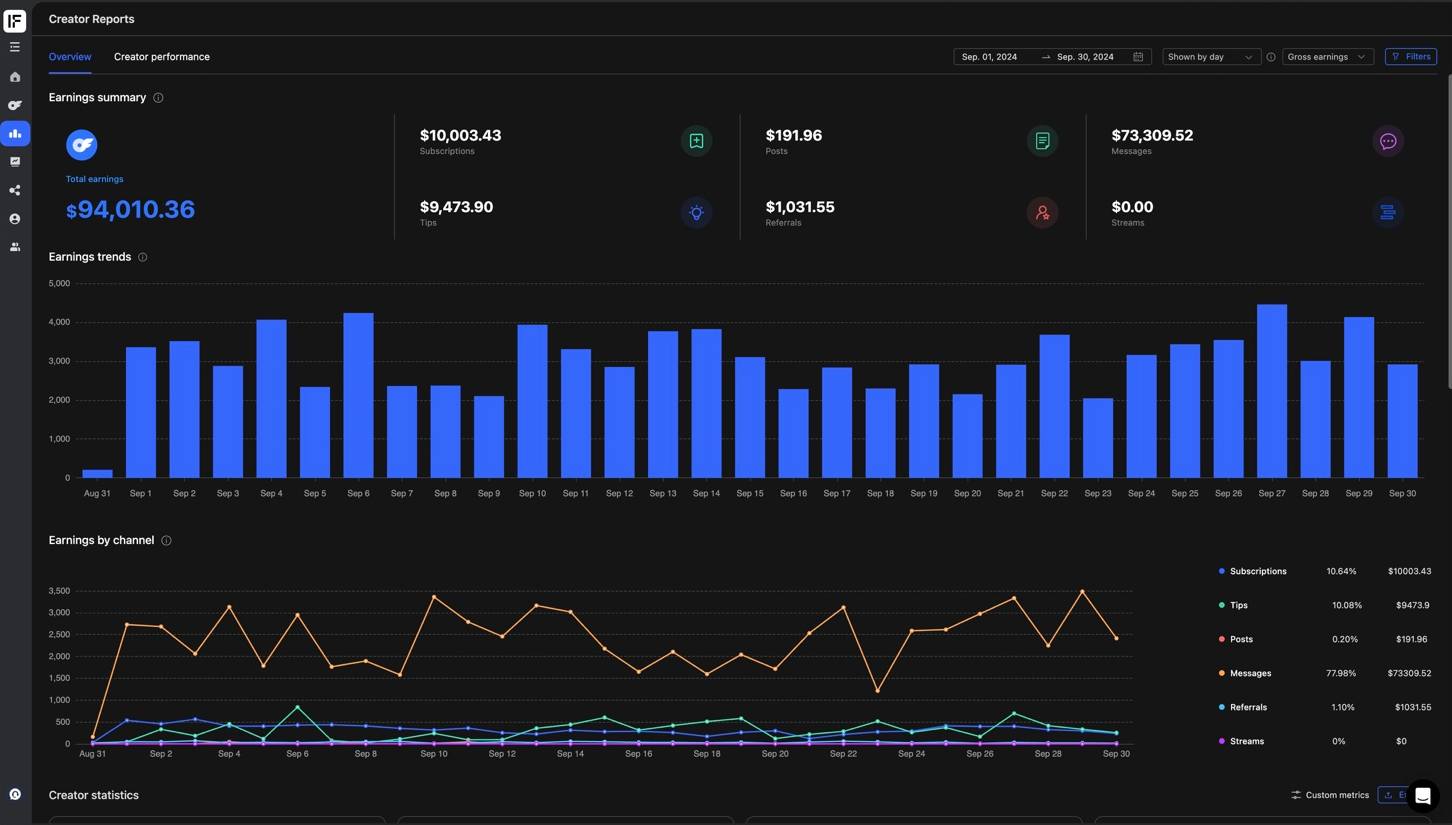
| September | Phase 2 | $75,208 | -24.8% |
| October | Phase 2 | $77,211 | +2.7% |
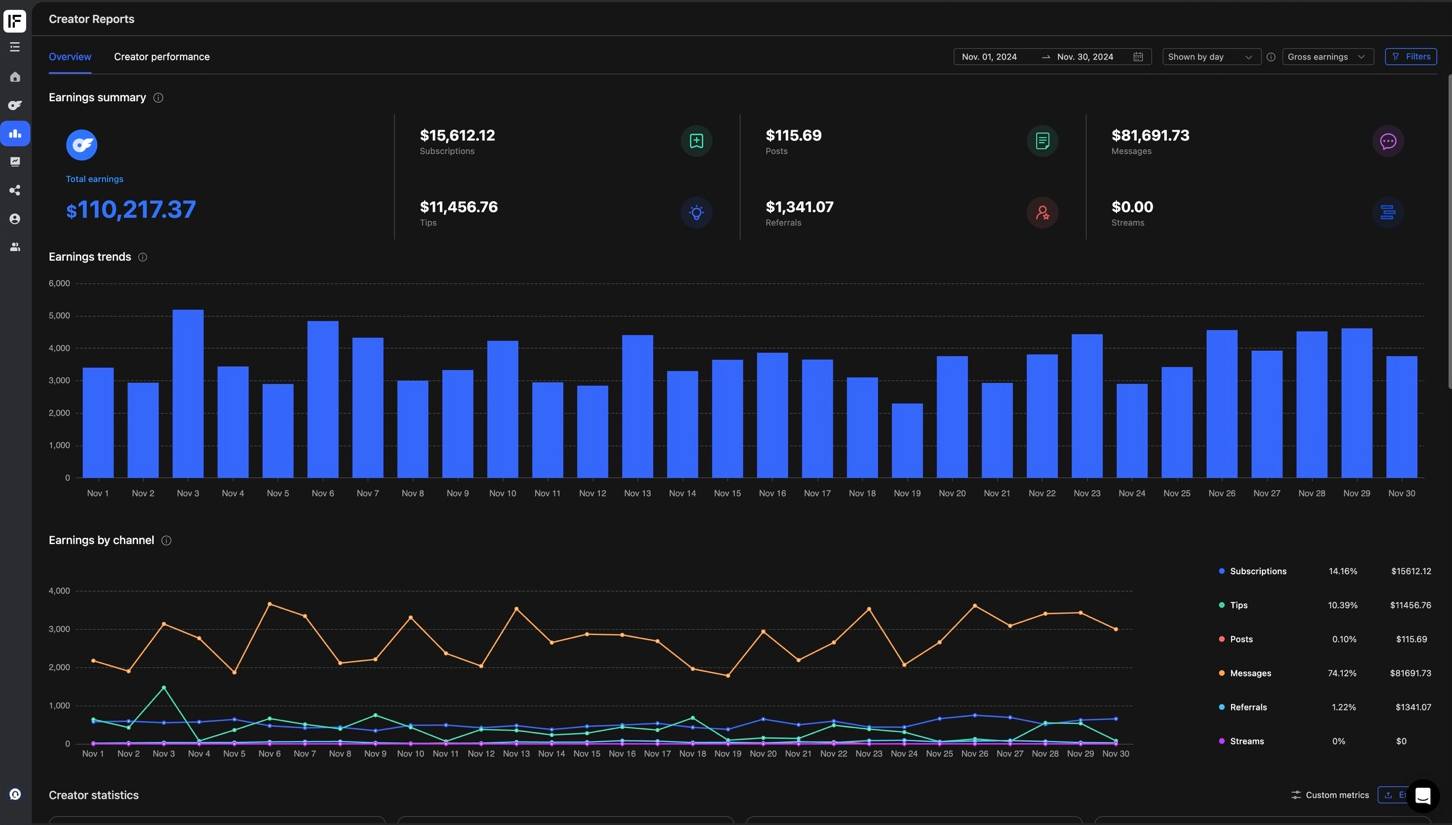
| November | Phase 2 | $88,174 | +14.2% |
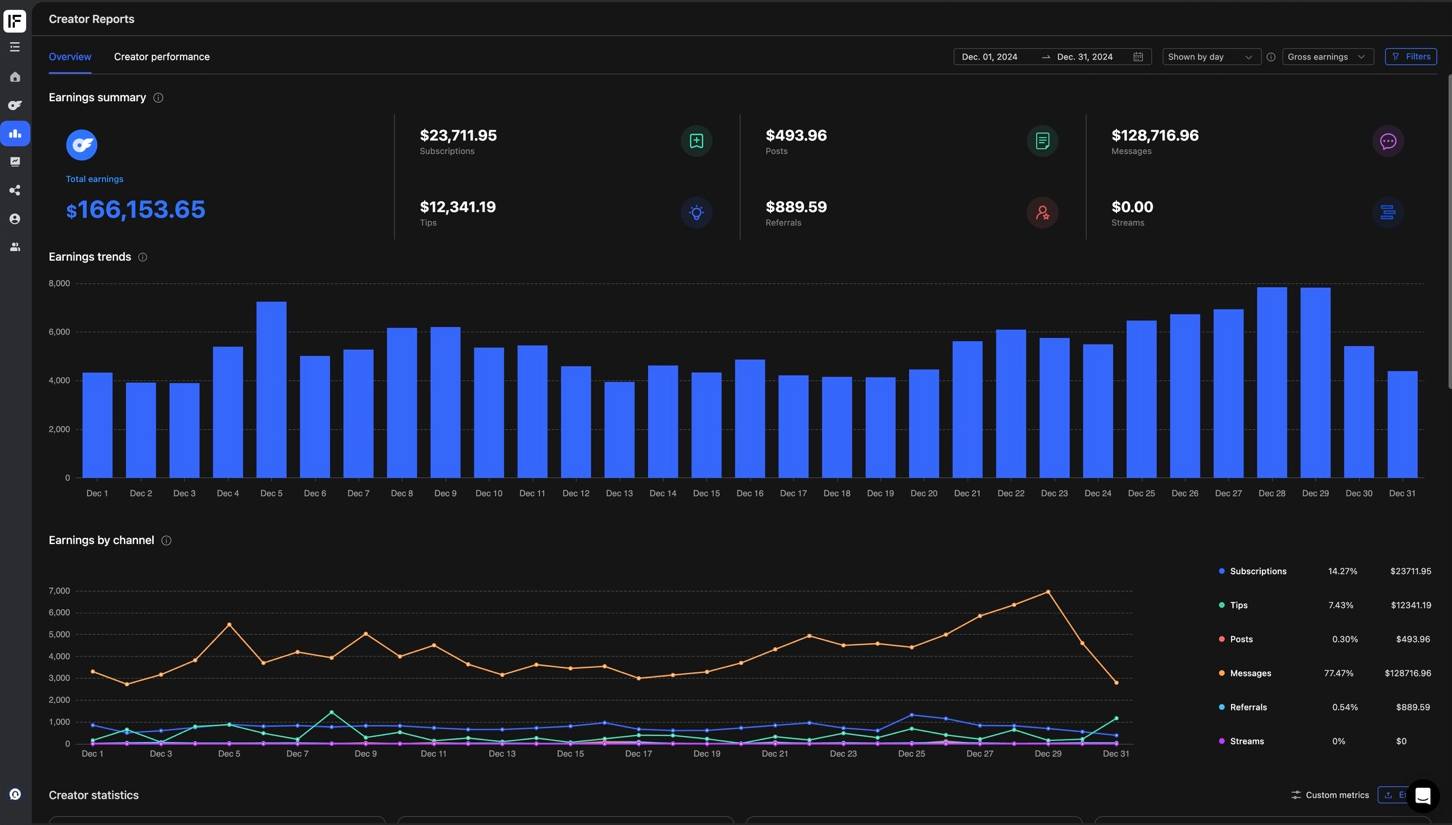
| December | Phase 2 | $132,923 | +50.8% |
Note: month-over-month variation is normal. The key insight is the sustained higher baseline after each phase transition — not individual monthly peaks.
Verified screenshots
Direct screenshots from the creator's account dashboard. Click any month to view full size.
Personal details redacted to protect creator privacy.
Revenue mix & insights
Professional chat handling significantly increased message volume and conversion rates. The single biggest revenue multiplier.
Optimised pricing and content tiers improved subscriber retention and average subscription value.
Improved fan relationships and engagement led to increased voluntary tipping behaviour.
The most significant revenue multiplier was the transition to our in-house chat team. This single change improved average fan value by optimising response timing, conversation flow and monetisation opportunities — without requiring additional content from the creator.
Creators who manage their own messaging often undervalue their time or respond inconsistently. Professional handling ensures every conversation is treated as a revenue opportunity.
Compliance & transparency
All data is from a real managed account. Creator identity has been anonymised to protect privacy.
All figures are NET revenue, after the standard 20% platform fee deduction.
Results depend on many factors including content quality, consistency and market conditions.
Past performance does not guarantee future results. This is documentation, not a promise.